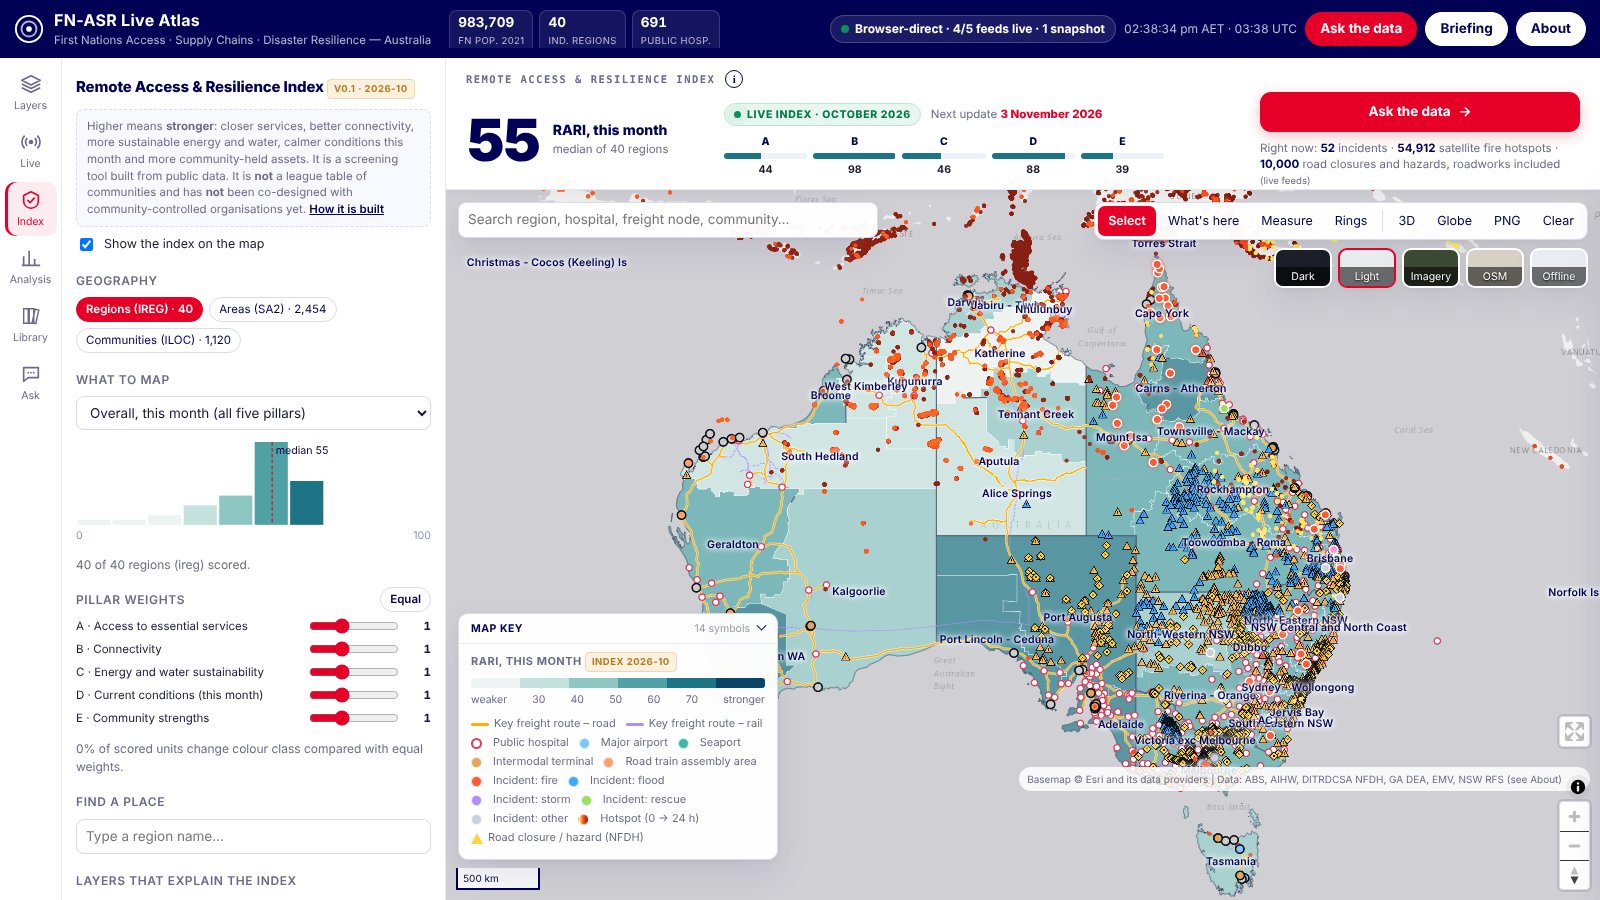
In remote Australia, distance shapes everyday decisions: reaching a clinic, keeping a phone signal, getting supplies through when a road floods. This atlas puts the public evidence on these questions on one map for decision makers: health services, emergency services, connectivity, energy and water, live fires and road closures, and the community-held strengths that national statistics usually leave out, such as native title, Indigenous Protected Areas, ranger groups and Aboriginal corporations. A monthly index summarises them for regions, areas and communities, with an uncertainty band on every score.
Live map with the index, unit profiles, what-if weights and downloads. Works on desktop; on a phone use landscape.
 Launch the atlas →
Measured at the 2,316 places where people live (ABS Urban Centres and Localities, plus Indigenous Locations for smaller communities). Straight-line distances.
For one settlement in ten it is more than 78 km.
306 services listed in the National Health Services Directory.
Owned, managed, co-managed or held under other special rights (ABARES 2024). 15% is dedicated as Indigenous Protected Areas, and 1,309 settlements are within 50 km of an Indigenous ranger group.
Coverage reported by the carrier to the ACCC, not measured signal.
In the 24 hours before the 2026-10 build; 1,246 had a flood, weather or hazard road disruption within 50 km (planned roadworks excluded).
Out of 2,123 where those months are normally wet enough to judge; 124 settlements had 10 or more days at 35 °C or hotter in 2026-09.
Higher always means stronger. A score is a screening signal, not a ranking of communities.
| Id | Indicator | How it is measured |
|---|---|---|
| A1 | Primary care | Straight-line km from where people live to the nearest GP, Aboriginal health service or nurse-led clinic |
| A2 | Public hospital | Straight-line km to the nearest public hospital |
| A3 | Pharmacy | Straight-line km to the nearest community or hospital pharmacy. Remote Aboriginal health services also supply PBS medicines on site under the s100 RAAHS program, which this distance does not capture |
| A4 | Aboriginal community health service | Straight-line km to the nearest Aboriginal and Torres Strait Islander health service (NHSD) |
| A5 | Emergency services | Straight-line km to the nearest police, ambulance, fire or SES facility |
| B1 | Mobile network choice | Number of mobile networks (Telstra, Optus, TPG) with a site within 10 km |
| B2 | 4G outdoor coverage | Share of settlements inside Telstra's reported 4G outdoor coverage |
| C1 | Rooftop solar installed | Cumulative small-scale solar installations per 100 residents (postcode data assigned by postcode centroid) |
| C2 | Recent solar uptake | Solar installations in the latest 12 months per 1,000 residents (recent months are revised upward) |
| C3 | Rainfall, last 3 months | 3-month rainfall percentile against 1991-2020 for the same months; left blank where those months are normally dry |
| D1 | Extreme heat days | Days with maximum temperature of 35 C or more in the latest complete month |
| D2 | Active fires nearby | Satellite fire hotspots (polar orbit, last 24 h at build) within 20 km |
| D3 | Road disruptions nearby | Current flood, weather, damage and other hazard closures within 50 km (NFDH national + NT Road Report); planned roadworks, breakdowns and crashes excluded |
| E1 | Indigenous estate | Share of area in the total Indigenous estate (Indigenous owned, managed, co-managed or subject to other special rights such as native title), ABARES 2024, from 100 m data |
| E2 | Indigenous Protected Areas | Share of area dedicated as an Indigenous Protected Area |
| E3 | Indigenous ranger group | Straight-line km to the nearest Indigenous Ranger Program group |
| E4 | Aboriginal and Torres Strait Islander corporations | Registered ORIC corporations (main place of business postcode) per 1,000 Aboriginal and Torres Strait Islander residents |
